Note
Go to the end to download the full example code.
Velocity-aware clustering and tracking#
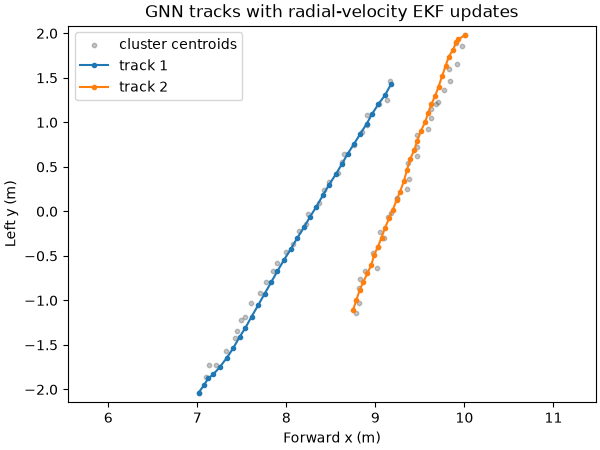
Track two synthetic radar targets through crossing trajectories. Each frame contains several noisy points per target; DBSCAN produces measurements for the stateful Kalman/EKF tracker.
from __future__ import annotations

import numpy as np
from matplotlib import pyplot as plt

from pyradar.base import PointCloud, TrackingConfig
from pyradar.rsp import MultiTargetTracker, dbscan

rng = np.random.default_rng(4)
tracker = MultiTargetTracker(
    TrackingConfig(
        enabled=True,
        dimensions=2,
        processNoise=0.8,
        measurementNoise=0.3,
        radialVelocityNoise=0.5,
        gatingThreshold=13.8,
        confirmationHits=2,
        deletionMisses=4,
    )
)

measurementHistory: list[np.ndarray] = []
trackHistory: dict[int, list[np.ndarray]] = {}
for frameId in range(32):
    time = frameId * 0.1
    centres = np.array(
        [
            [7.0 + 0.7 * time, -2.0 + 1.1 * time, 0.0],
            [10.0 - 0.4 * time, 2.0 - 1.0 * time, 0.0],
        ]
    )
    velocities = np.array([[0.7, 1.1, 0.0], [-0.4, -1.0, 0.0]])
    xyz = np.vstack([centre + rng.normal(0, 0.09, size=(8, 3)) for centre in centres])
    fullVelocity = np.repeat(velocities, 8, axis=0)
    unit = xyz / np.linalg.norm(xyz, axis=1, keepdims=True)
    radial = np.sum(fullVelocity * unit, axis=1)
    points = PointCloud(
        xyz=xyz,
        power=np.ones(xyz.shape[0]),
        snr=np.full(xyz.shape[0], 15.0),
        radialVelocity=radial,
        sourceBins=np.zeros((xyz.shape[0], 4), dtype=np.int64),
        timestamp=time,
        frameId=frameId,
    )
    clusters = dbscan(
        points,
        eps=0.42,
        minSamples=3,
        velocityScale=0.25,
        dimensions=2,
    )
    tracks = tracker.update(points, clusters=clusters, timestamp=time)
    measurementHistory.append(clusters.centroid.copy())
    for index, trackId in enumerate(tracks.trackId):
        if tracks.status[index] != "deleted":
            trackHistory.setdefault(int(trackId), []).append(
                tracks.position[index].copy()
            )

figure, axis = plt.subplots(figsize=(6, 4.5), constrained_layout=True)
measurements = np.vstack(measurementHistory)
axis.scatter(
    measurements[:, 0],
    measurements[:, 1],
    s=10,
    alpha=0.35,
    color="0.35",
    label="cluster centroids",
)
for trackId, positions in sorted(trackHistory.items()):
    path = np.asarray(positions)
    axis.plot(path[:, 0], path[:, 1], marker=".", label=f"track {trackId}")
axis.set(
    xlabel="Forward x (m)",
    ylabel="Left y (m)",
    title="GNN tracks with radial-velocity EKF updates",
)
axis.legend()
axis.axis("equal")
plt.show()
Total running time of the script: (0 minutes 0.164 seconds)